
Case Study
What we’re doing: Offering a Free 21 Day Challenge
This month we’re sharing with you what we’re doing to grow our membership. We practice what we preach in our membership, so we are doing this as organically as possible. First, let’s start with some fundamentals.
Our idea: a free 21 day challenge
We decided to try a free 21 day challenge to drive our specific audience (entrepreneurs, solopreneurs, startups, photographers, bloggers, small business owners/marketers) into a funnel toward A Cup of Content’s $30/month membership.
We decided on a graphic design challenge, which we called 21 Day Graphic Design Camp. We purchased the domain and set up a homepage landing page with registration form on February 6, 2017. The challenge was set to run March 13-April 2, 2017. We opened registrations on February 9 and closed registrations on March 19. We had 28 registrations during that time.
Communication with registrants
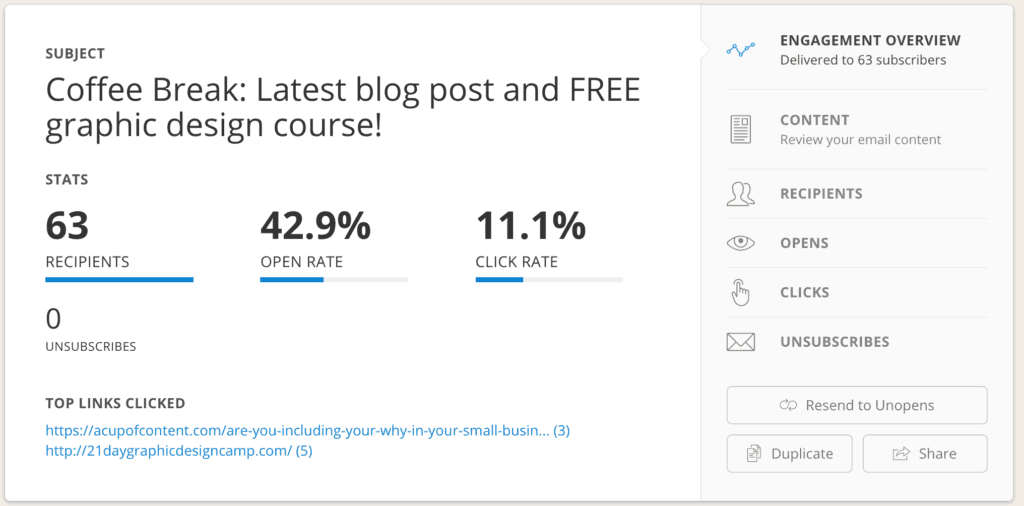
Registrants were sent an automated follow-up email reminding them to join our private Facebook group for the challenge (see our email here). Within 24 hours we sent them an individualized email welcoming them to the challenged and asking them what they were hoping to gain from it. Those who hadn’t requested to join the private Facebook group were reminded and provided a direct link to the group. Out of 28 registrations and 27 emails sent from February 6 to March 13, we had 5 responses (see the responses here).
Membership Special Content leading into the challenge
We also decided to double up our membership’s special monthly content for February with this same challenge that we packaged for them as “Designing Graphics for Content”.

Our members knew that we’d be doubling up this content with the challenge, and 4 members signed up for the challenge. (This number is included in the total number of registrants noted earlier.)
Content created for the challenge itself
We created a special Pinterest board for the challenge that shows all of the examples (plus some extras) we’d refer to during the challenge. We created our own descriptions for each individual pin so that challenge members would know what pins went with what parts of the challenge. We sent emails out every day during the challenge, and we dripped the content throughout the challenge (meaning we released each day instead of all of it at once). We had daily Facebook group posts that correlated to the challenge, and we directed our registrants to share their homework and ask questions on the related day in the Facebook group to keep everything organized.
Social media insights
Since the goal of this challenge is to grow A Cup of Content’s membership, we did not create specific social media accounts for this challenge. Remembering that we started sharing the challenge on February 9, what follows is A Cup of Content’s social media insights before and after the challenge:
- Facebook: Start 75, End 80
- Twitter: Start 80, End 76
- Instagram: Start 153, End 202
- YouTube: Start 6, End 10
- Vimeo: Start 0, End 0 (all but 2 videos are private, and all videos are only shared with A Cup of Content members)
- LinkedIn Company page: Start 14, End 16
- Pinterest: Start 6, End 12 (21 Day Graphic Design Camp board: Start 6, End 11)
- GooglePlus: Start 4, End 4
- ConvertKit sign-ups: 3 new signups
We typically post on social media 5 days each week (once per day), but during this campaign we posted every day of the week. Our content was created with the purpose of driving visitors to our website’s blog post “Are you including your ‘why’ in your small business graphic design?”.
Blog post insights
We posted the blog post “Are you including your ‘why’ in your small business graphic design?” on March 1, 2017. We used our own Two Week Content Planner that our members received in December 2016–again, practicing what we preach. The Two Week Content Planner provides a way to create 2 weeks of content from a single blog post, so we utilized that method for this campaign. We had 12 hits to this blog post during our promotion, all directed organically (not paid) via social media and email marketing.
Advertising insights
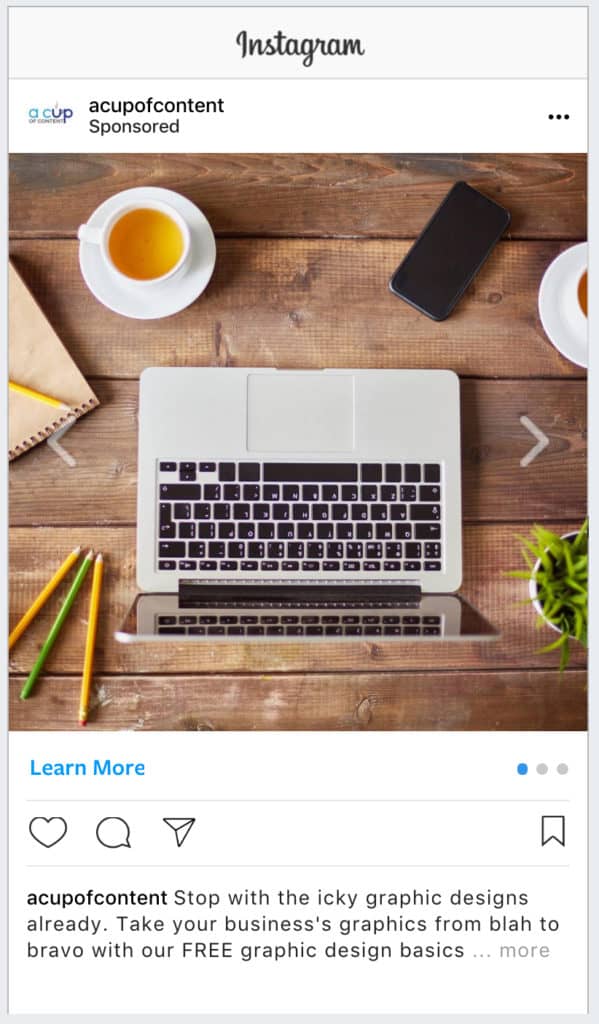
We chose to focus our advertising spend on just Facebook and Instagram for this particular campaign. We decided that if we got one new member out of this, then $30 (the one month cost of a member) would be a good spend amount for this campaign. We started by boosting our initial “launch” post on February 10, giving it a $30 spend through March 12. On February 16, we decided to stop the campaign, spending $6.57. We didn’t feel like that particular post would be a good one to continue with throughout the entire campaign. We also had great feedback from people about the first sentence on our landing page: “Stop with the icky graphic designs already.” So we decided to create a carousel ad post on Facebook that would echo on Instagram and gave it an ad spend of $30 from February 20 through March 12. What follows are screenshots from our second campaign.
Facebook Carousel Ad:

Instagram Carousel Ad (used same 3 images as Facebook Carousel Ad):
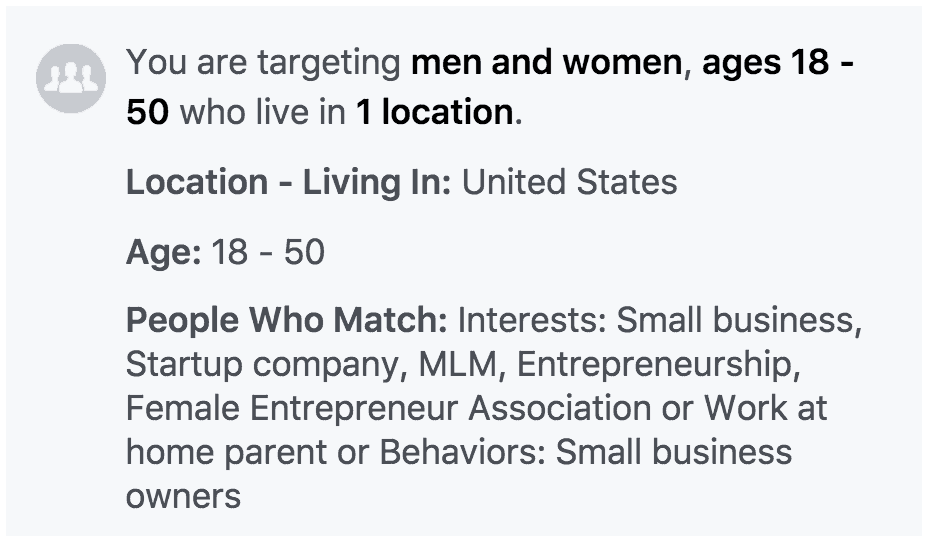
Here are the details of the audience we chose for this campaign:
As of the campaign’s end on March 12, we had 2,452 in reach and 528 engagements, according to Facebook’s Advertising Insights. We did not add the Facebook Pixel to our website during this campaign.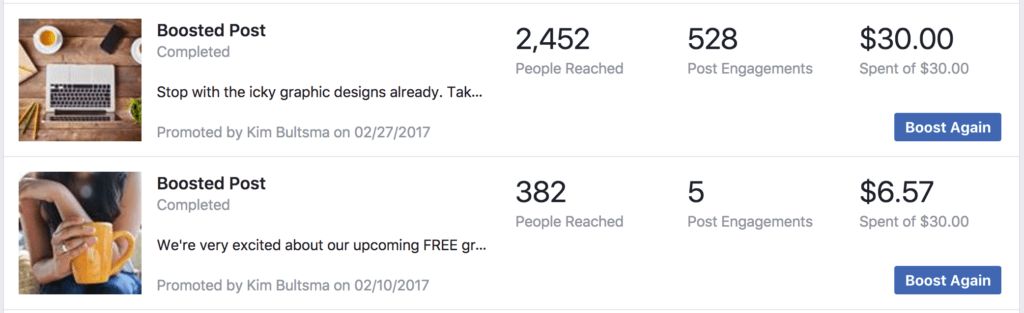
Website analytics
We think it’s important to cover all analytics for this particular campaign for both A Cup of Content’s website as well as 21 Day Graphic Design Camp’s website. As you recall, we used a mix of social media referrals to both websites. When we referred to A Cup of Content’s website, however, we referred directly to the bog post “Are you including your ‘why’ in your small business graphic design?”, which also included a link to the signup page on 21daygraphicdesigncamp.com as a CTA at the end of the post.
A Cup of Content’s website analytics
According to our Google Analytics, 7 visits to our site were from our social media posts that directed traffic to our blog post “Are you including your ‘why’ in your small business graphic design?” Out of those visits, 0 signed up for the free “How do I identify my ‘why’?” worksheet while 0 went on to visit 21daygraphicdesigncamp.com.
[huge_it_slider id=”1″]
We weren't too terribly surprised at this, mainly because we had directed so many people to visit 21daygraphicdesigncamp.com directly via social media and our live videos on Facebook, Instagram, and YouTube. The blog post went live on March 1, and we started sharing it March 2 via email, initially and then on social media.
ConvertKit stats for March 2 email share of 21 Day Graphic Design Camp:
21 Day Graphic Design Camp’s website analytics
Huge faux pas on our part: we neglected (aka forgot) to establish our Google Analytics for this website until Monday, February 27! Bah. But according to our Google Analytics from February 27 forward, we had 48 total visits to the site with 28 sign-ups. Out of those 48 visits:
- 29 visits to our site were assumed to be from organic (aka unpaid) traffic to our homepage (from what we can gleam knowing that paid traffic most likely came from Facebook and Instagram).
- 17 visits to our site were assumed to be from paid social media posts that directed traffic straight to our homepage.
- 48 total visits to our site occurred February 27 – March 12.
[huge_it_slider id=”2″]
Cost breakdown.
Here is a breakdown of the cost involved in creating this challenge:
- Domain purchase: $9.06 (year)
- Hosting: $180 (year). Of note: you can find budget hosting for cheaper, but you will need to do your own maintenance, backups, etc.! Note: We did not pay this as we have an agreement established with my hosting provider due to the amount of websites we develop on his server. You can purchase hosting for $9.88 from Namecheap (for the first year).
- WordPress Membership plugin: free
- Divi theme: $249 (one time fee). Since we develop websites using Divi, we have a developer's license. You can purchase the Divi theme for $89/year. You can also use any of WordPress's free themes, but you will have to incorporate much work. 🙂 Note: We purchased my Divi developer's license in 2016, so we're not going to include this price in the final breakdown.
- Facebook and Instagram ads: $36.57
- Adobe Creative Cloud: $52.74 (monthly). We used Photoshop, Illustrator, Premiere Pro, and InDesign to create the content for this challenge. Note: Instead, you can use Canva for free!
- Adobe Stock photos: $31.64 (monthly). We get 10 images per month on this plan. Note: You can use many free stock photos; see our blog post on it here.
- Envato Elements: $19 (monthly). We used this for some examples in the course, as well as the logo. Note: You can use your own logo, too, to save money!
- YouTube: free. We are also monetizing this campaign!
- Screenflow: $99. We used this to record the Canva and Pixlr how-to videos. You may find some other screencasting software online, too, but most of it is in the $99 price range.
The cost for this particular challenge: $677.01.
This is as if you were paying for all of the above to get started, including the developer's license for Divi.
The least amount you could pay for this challenge: $48.94.
This would be purchasing the domain at $9.06, a year of hosting through Namecheap at $9.88, purchasing $30 in Facebook and Instagram ads, using a free WordPress theme, using free stock photography, using Canva for graphics editing, and using YouTube's free video editor.
Our real cost in this: $112.44.
This includes the domain, Adobe CC and Stock, Facebook and Instagram ads, and Envato Elements. (We paid for the other one-time items in the past, so we aren't including them here.)
Final thoughts.
We learned a great deal from our first free challenge!
- Install Analytics on your website immediately! We are embarrassed to admit we even made this huge mistake, as we create many websites for businesses and have it as part of our system. This proves you should follow the same system for yourself that you establish for your clients.
- Create Goals in Analytics. We think this would give us some more specifics as to what clicks really came from where, etc.
- Make better use of Pretty Link Lite to track clicks from the blog post on A Cup of Content to the challenge.
- Figure out a way to implement the Facebook Pixel into the “thank you” portion of the registration (that's where it best records conversions!). Since we used the free WordPress Membership plugin, we had a difficult time figuring out how to do this. It's something we will work on before offering the next challenge.
Are we disappointed in the turn out? NO! We understand that organic is slow going.
Part 2 is coming at the beginning of April. In it, we will discuss the outcomes of our challenge, including the final funnel we used and its outcomes. Part 3 will come in early May when we complete the funnel. Stay tuned!
Have questions? Ask below!
Anything we missed here? Questions on other particulars? Ask it in the comments!
